Philosophy
The Program of All-inclusive Care for the Elderly (PACE) operates on the belief that seniors with chronic care needs, and their families, do better when services are provided in and by their local communities. By providing or coordinating all needed medical and supportive services through an interdisciplinary team, PACE programs can provide the entire continuum of care and services to older adults with chronic care needs while enabling them to maintain their independence in their homes for as long as possible.
PACE Service Areas
PACE providers are awarded a service area in a three-way agreement between the state administering agency, the Centers for Medicare & Medicaid Services, and the provider organization. An individual must live within the designated service area to be eligible for program enrollment.
Figure 1 shows the PACE service areas of the 134 programs.
Figure 1: PACE Service Areas of Active 134 Programs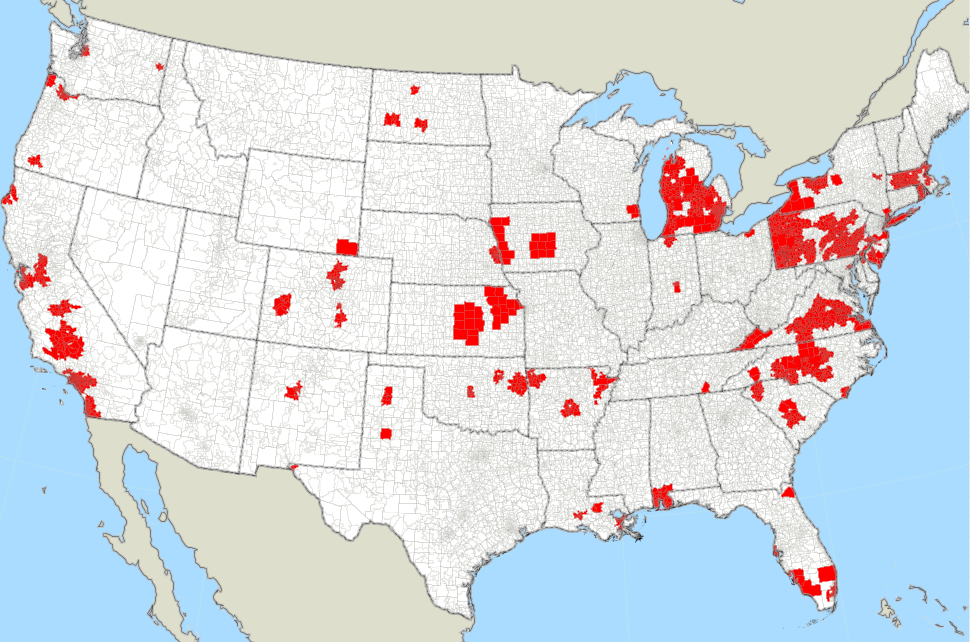 Source: Health Dimensions Group
PACE programs cover 218,124 square miles as of August 2020. The number of programs continues to increase with average annual growth of five programs nationally since 2015.
PACE Eligibility Criteria
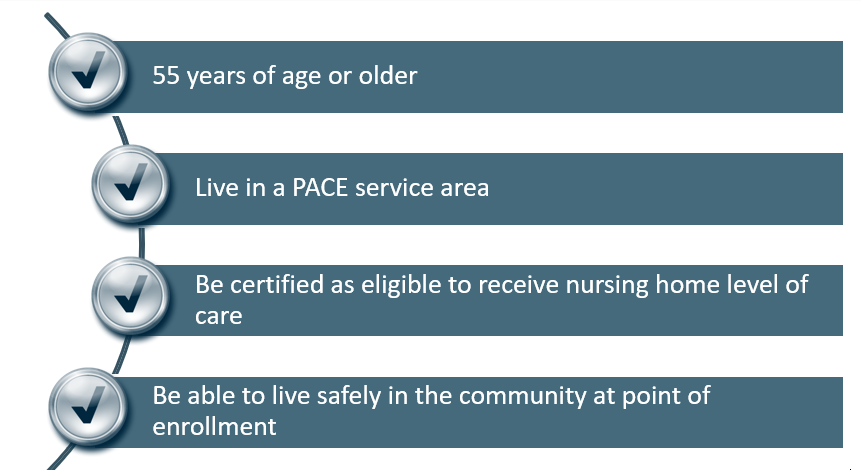
Eligibility for enrollment into PACE is similar in all states. Figure 2 summarizes eligibility requirements.
Figure 2: Eligibility Requirements for Enrollment into PACE
 Diversity of Individuals Age 55+
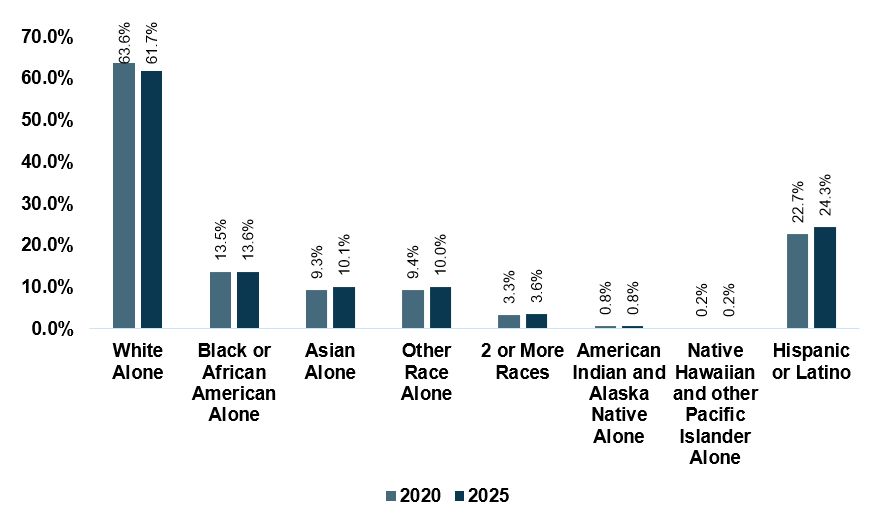
Although seniors are typically defined as being 65 years of age and older, eligibility for PACE begins at age 55. In a recent analysis performed by HDG, a majority of PACE eligibles identify as “white alone” in 2020 and 2025. However, the senior population is becoming slightly more diverse, as shown on Figure 3.
Figure 3: Diversity of Seniors Age 55+
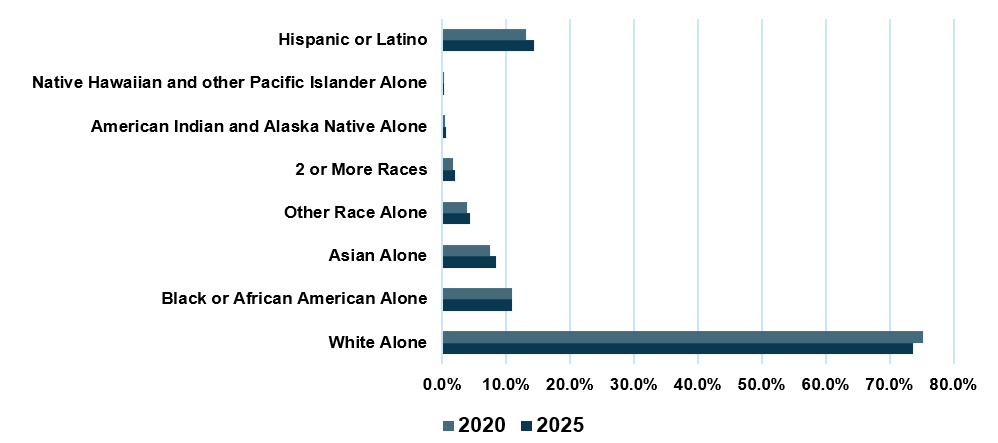 Source: Health Dimensions Group, Environics Analytics and Claritas, LLC
Projected Growth of PACE Eligibles by PACE Program 2020-2025
Although all PACE programs are projected to grow in the number of individuals eligible for enrollment into PACE over the next five years, each service area is changing at a different rate. Programs projected to increase less than 5 percent, for example, will not be able to rely on population growth alone to reach enrollment targets, but will also need to increase market share. Figure 4 summarizes the projected growth of the 134 PACE programs from 2020 to 2025.
Figure 4: Projected Service Area Growth 2020-2025
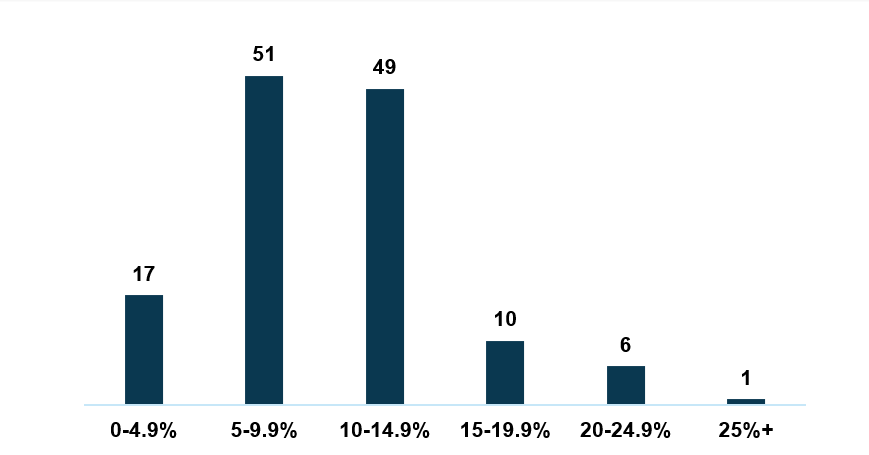 Source: Health Dimensions Group, Environics Analytics and Claritas, LLC
As shown on Figure 4, most programs will increase between 5 and 15 percent over the next five years. Seventeen programs, though, will have minimal increases, requiring strong marketing efforts to maximize enrollment opportunities by increasing market share.
Potential Enrollees with Access to PACE
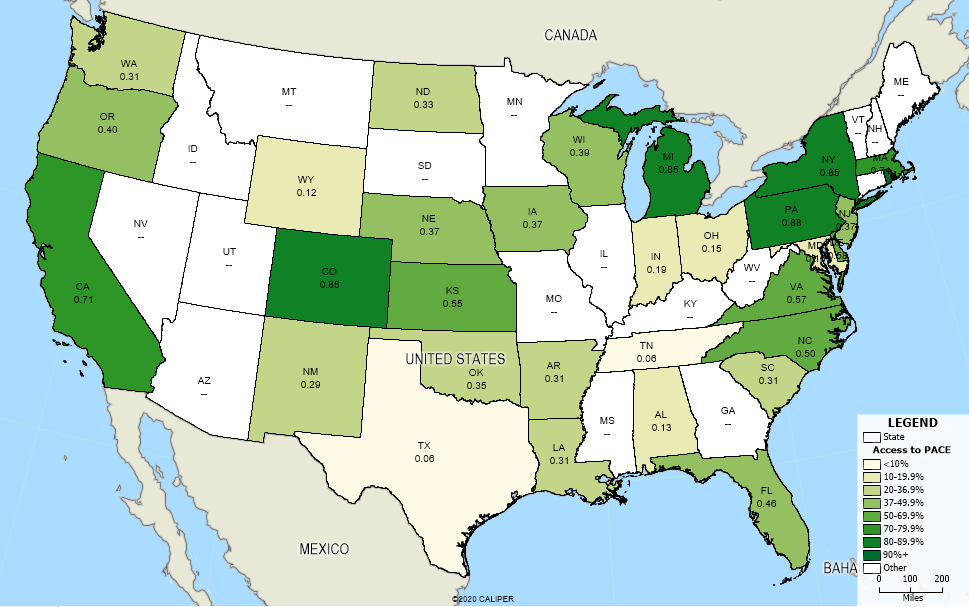
The number of PACE programs continues to increase but not everyone eligible for program enrollment lives within a PACE service area. Currently, 31 states are supportive of the PACE model, leaving 19 states with no programs. The number of individuals within the 31 PACE states with access to a PACE program varies tremendously, as shown on Figure 5.
Figure 5: PACE Eligibles with Access to PACE in 31 States Supporting the PACE Model
 Source: Health Dimensions Group
In August 2020, 42.6 percent of individuals living within a supportive PACE state have access to a PACE program, which is up from 35.7 percent in 2016.
Change in Workforce Population
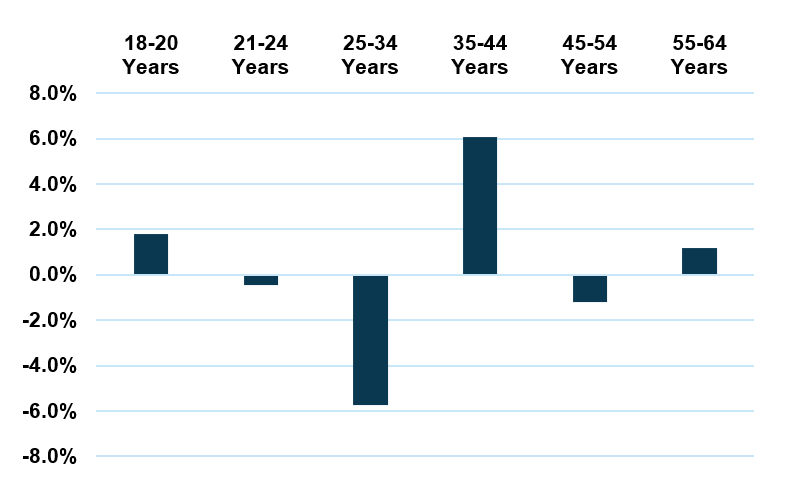
Maintaining quality staff is among the many challenges of operating a successful PACE program. Overall, the workforce population age 18 to 64 is projected to increase minimally over the next five years, with large variations by age cohort. Health Dimensions Group (HDG) has noted the anticipated changes in Figure 6.
Figure 6: Workforce Change 2020-2025
 Source: Health Dimensions Group, Environics Analytics and Claritas, LLC
As shown on Figure 6, the 35 to 44 age cohort represents the largest projected growth among cohorts in the workforce population. Age cohorts, 21-24, 25-34, and 45-54 are projected to decline, indicating PACE programs will require strong competitive packages to attract and maintain quality employees.
Diversity of Workforce Population
Like the changes occurring within the senior population, the larger workforce population is becoming more diverse. The workforce population is more diverse than the seniors being cared for, a trend that will continue over the next five years. HDG noted the change in Figure 7.
Figure 7: Diversity of Workforce Population
 Source: Health Dimensions Group, Environics Analytics and Claritas, LLC
Looking Forward
PACE continues to be the gold standard of care for dual eligibles, i.e., those eligible for both Medicare and Medicaid. As more programs come online, more seniors will have access to the model. For both mature and new PACE programs, demographics will increase, resulting in additional demand. With the number of seniors increasing, staffing challenges will intensify requiring strong efforts to attract and maintain quality staff.
For More Information
As a National PACE Association Technical Assistance Center, HDG has successfully assisted many organizations with PACE market and financial feasibility studies, program development and implementation support, and operational improvement. If you would like to learn more about how HDG can assist you in exploring PACE as a solution in today’s challenging health care environment, please call or email us at 763.537.5700 or info@hdgi1.com and visit our website.