
Medicare Advantage plans are an alternative to Medicare Fee-for-Service (MFFS) options to receive Medicare Part A and Part B coverage. Sometimes called Part C or MA plans, Medicare Advantage plans are offered by Medicare-approved private companies.
Medicare beneficiaries can only be enrolled into MFFS or Medicare Advantage. The proportion of Medicare beneficiaries who have chosen Medicare Advantage continues to grow and will soon outnumber those in traditional MFFS plans. These growth trends have important implications for providers and the patients they serve.
Medicare Advantage Growth from May 2017 to May 2022
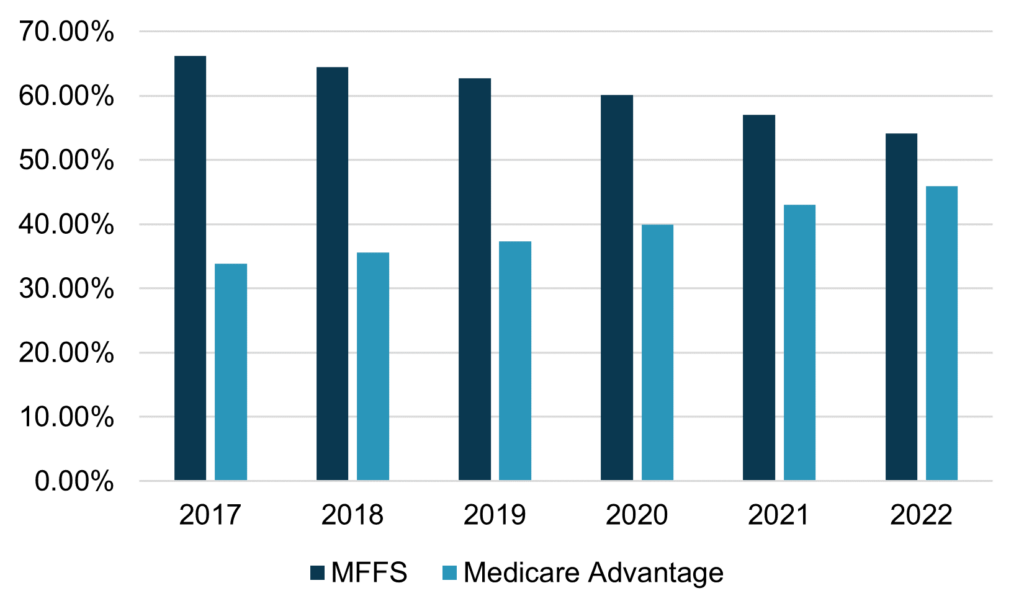
In May 2017, approximately two-thirds of Medicare beneficiaries were enrolled into MFFS. Medicare Advantage had slowly been increasing, but nationally, MFFS remained the favored plan option. From May 2017 to May 2019, Medicare Advantage market share increased approximately 1.7 percentage points each year. However, starting in 2020, Medicare Advantage growth increased a minimum of 2.6 percentage points each year, an accelerating growth rate. Figure 1 shows the MFFS vs. Medicare Advantage distribution from May 2017 to May 2022.
Figure 1: MFFS vs. Medicare Advantage Market Share, May 2017–May 2022
 Source: Centers for Medicare & Medicaid Services (CMS)
As shown in Figure 1, in May 2022, Medicare Advantage accounted for 46 percent of overall Medicare beneficiary enrollment. At current pace, Medicare Advantage will account for over half of Medicare beneficiaries within the next few years.
National Market Share
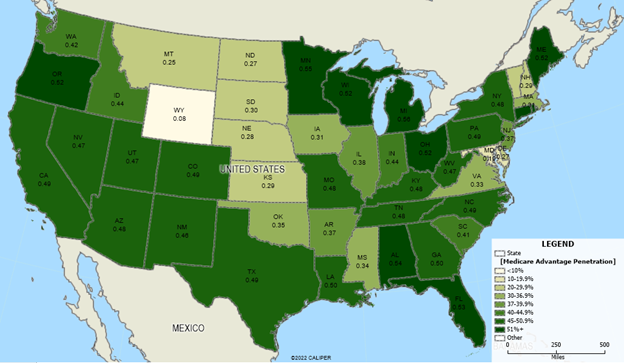
Although Medicare Advantage accounted for 46 percent of the overall Medicare beneficiaries in May 2022, penetration rate varies tremendously by geography. Figure 2 shows the Medicare Advantage penetration by state.
Figure 2: Medicare Advantage Market Share, May 2022
 Source: Centers for Medicare & Medicaid Services (CMS)
The following should be noted:
- Average penetration is 46 percent, but ranges from a low of 1.8 percent (Alaska) to a high of 56 percent (Michigan).
- States with the lowest penetration include Alaska (1.8 percent), Wyoming (7.8 percent), Maryland (18.8 percent), Montana (25.3 percent), and North Dakota (26.7 percent).
- States with lower penetration tend to be more rural, although there are exceptions, including Maryland.
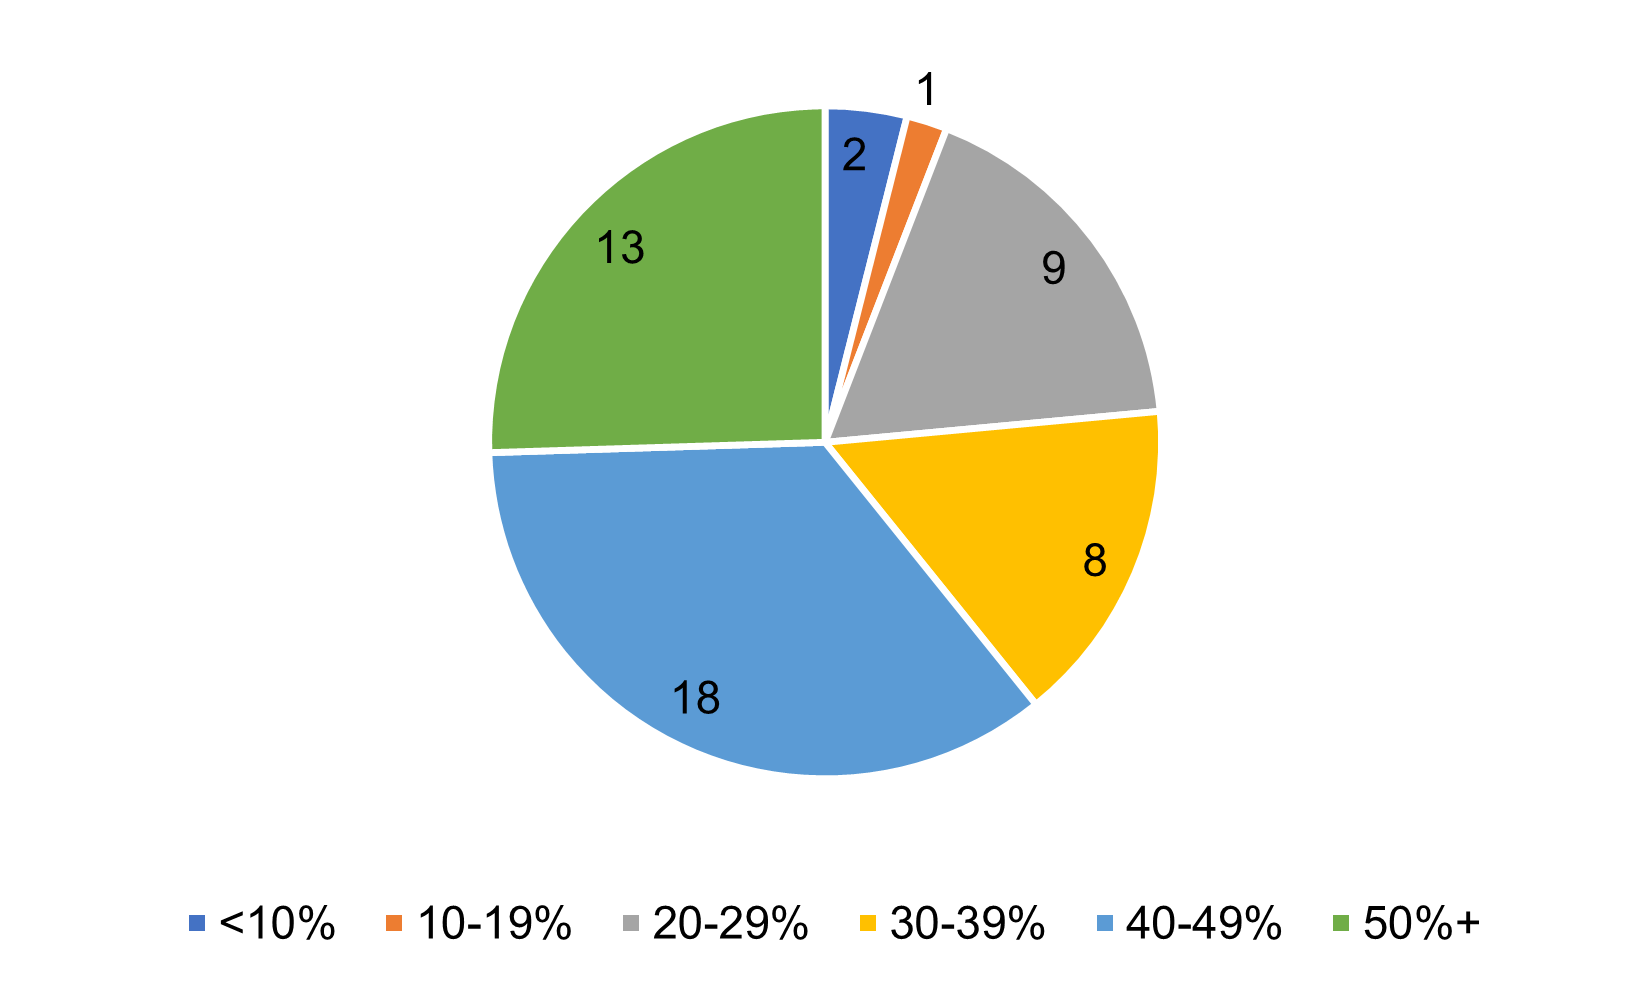
Figure 3 shows the number of states, including the District of Columbia, by Medicare Advantage penetration rate.
Figure 3: Medicare Advantage Market Share by Number of States
 Source: Centers for Medicare & Medicaid Services (CMS)
As shown on Figure 3, over half of states have Medicare Advantage penetration over 40 percent, indicating a sizeable percentage of the population choosing Medicare Advantage over traditional MFFS.
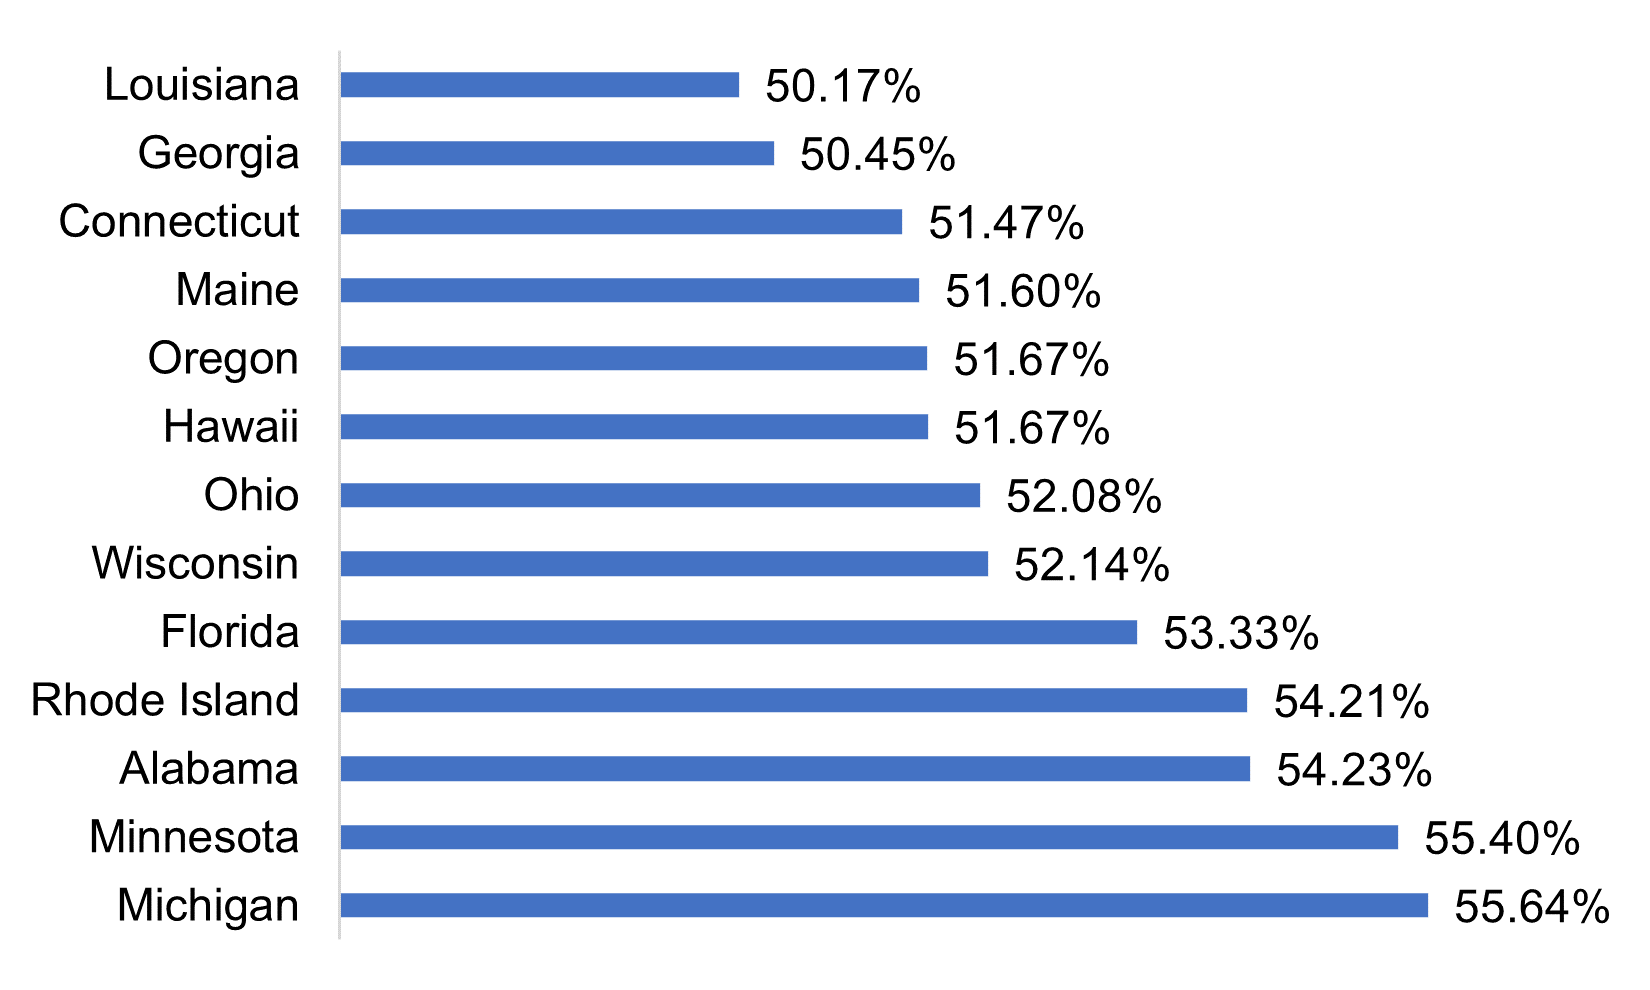
Figure 4 shows the states exceeding 50 percent penetration.
Figure 4: States with Highest Medicare Advantage Penetration, May 2022
 Source: Centers for Medicare & Medicaid Services (CMS)
Thirteen states have Medicare Advantage penetrations greater than 50 percent. Michigan has the highest penetration, followed by Minnesota, Alabama, Rhode Island, and Florida. There are an additional seven states currently between 48 and 50 percent penetration, and these will likely exceed 50 percent within the next one to two years.
States with Largest Growth
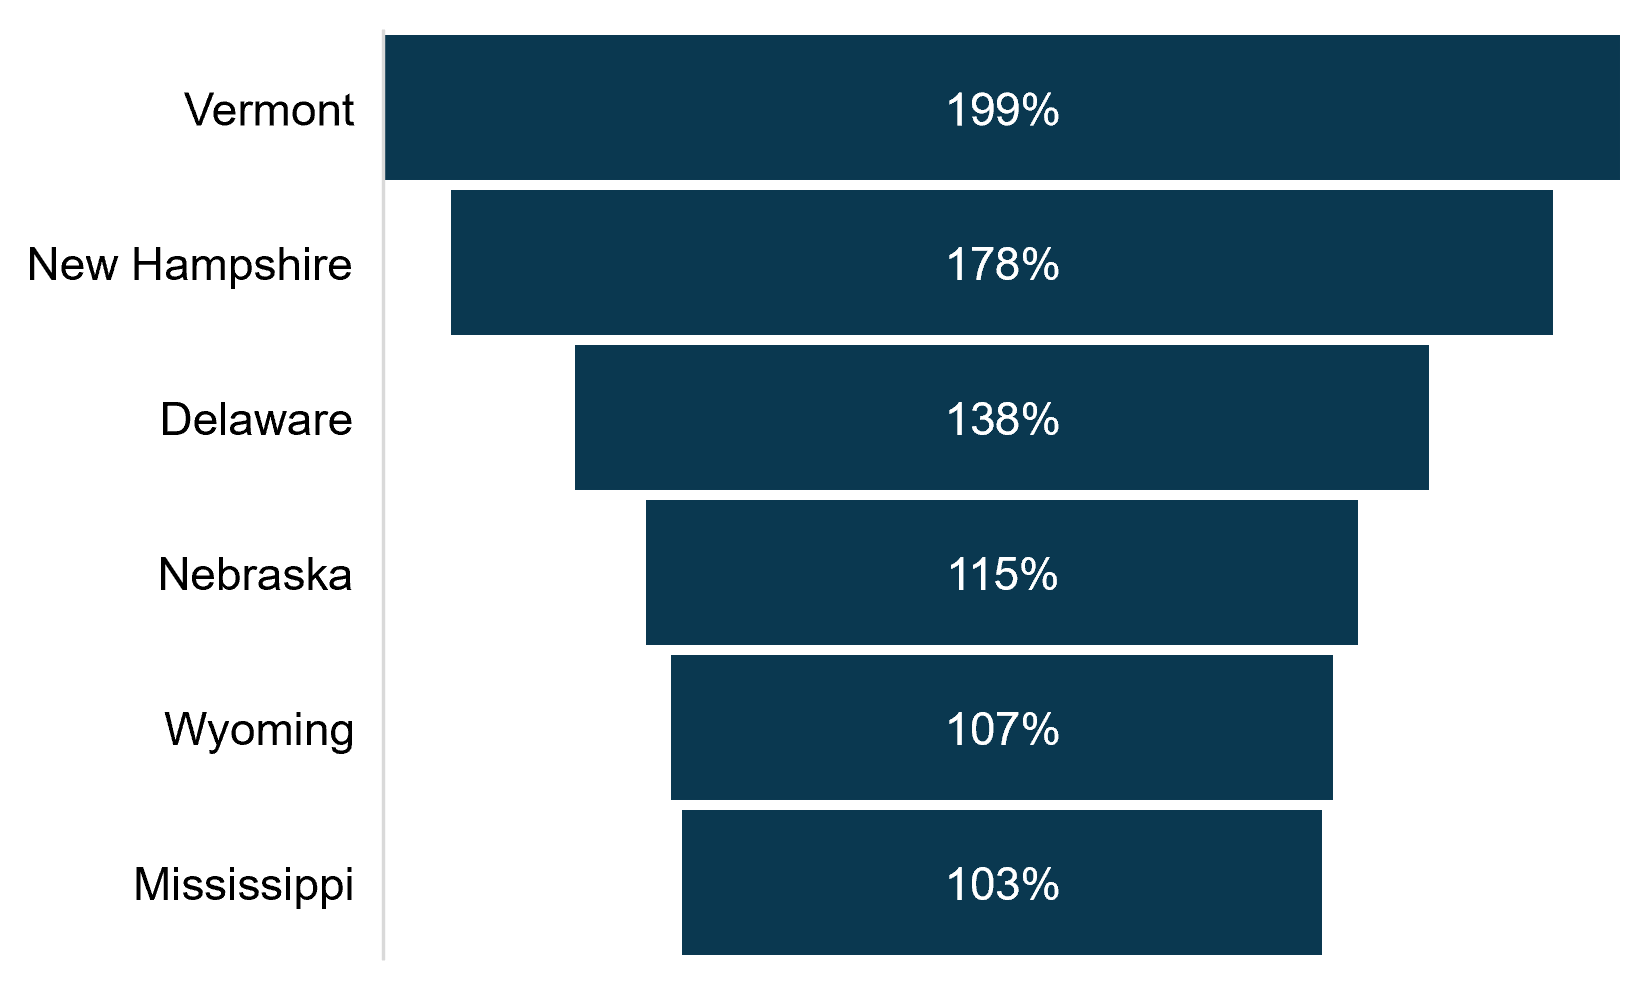
Figure 5 shows the states with the largest increase in Medicare Advantage penetration from May 2017 to May 2022.
Nationally, Medicare Advantage penetration increased by over a third, going from 34 percent in May 2017 to 46 percent in May 2022. Six states increased more than 100 percent during this timeframe, as shown on Figure 5. Generally, these states began with low Medicare Advantage penetration rates and doubled within the five-year span. Of these states, Mississippi has the highest Medicare Advantage penetration with 34 percent, followed by New Hampshire at 29 percent, and Nebraska at 28 percent.
Figure 5: States with Largest Growth in Medicare Advantage Penetration, May 2017–May 2022
 Source: Centers for Medicare & Medicaid Services (CMS)
Medicare Advantage by County
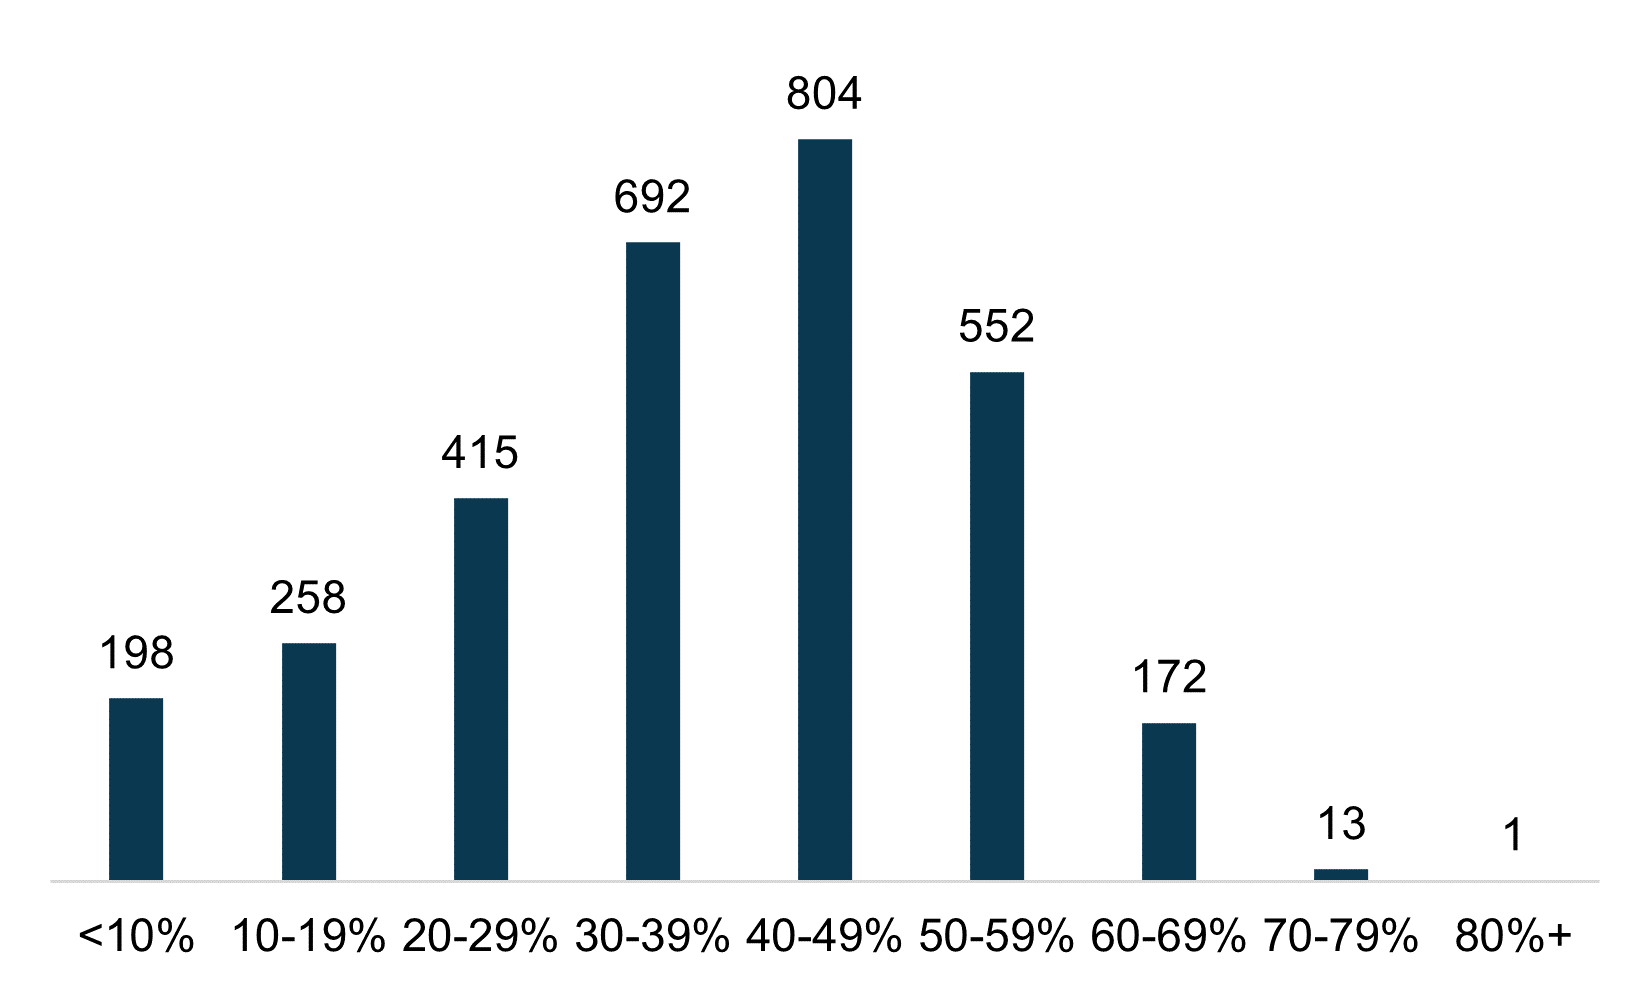
Medicare Advantage penetration can vary tremendously by county within each state. Health Dimensions Group (HDG) analyzed the over 3,000 counties that met CMS minimum reporting requirements. Figure 6 summarizes the number of counties by Medicare Advantage penetration.
Figure 6: Medicare Advantage Penetration by Number of Counties
 Source: Centers for Medicare & Medicaid Services (CMS)
Median county penetration is much lower (39.8 percent) compared to the national average penetration of 45.9 percent. However, the largest share of programs is between 40 and 49 percent. Counties with the highest penetration include Aitkin County, Minnesota (83 percent); Gallatin County, Kentucky (78 percent); and Hancock County, Tennessee (78 percent).
Change in Medicare Advantage Plan Types
Table 1 shows the distribution of Medicare Advantage plan types and enrollment change from May 2017 to May 2022.
Table 1: Medicare Advantage Plan Types Change, May 2017–May 2022
| Plan Type | Distribution of Plans 2017 | Distribution of Plans 2022 | Enrollment Change 2017–2022 | Enrollment Change Percent 2017–2022 |
| HMO/HMO-POS | 61% | 57% | 4,972,263 | 41% |
| Local PPO | 25% | 37% | 6,087,387 | 123% |
| Regional PPO | 7% | 2% | -630,822 | -47% |
| Medicare-Medicaid Plan HMO/HMO-POS | 2% | 1% | 25,579 | 7% |
| 1876 Cost | 3% | 1% | -438,864 | -70% |
| HCPP – 1833 Cost | 0% | 0% | -2,936 | -5% |
| National PACE | 0% | 0% | 14,404 | 39% |
| PFFS | 1% | 0% | -140,903 | -76% |
| MSA | 0% | 0% | 2,642 | 54% |
| Total | 100% | 100% | 9,888,750 | 50% |
Source: Centers for Medicare & Medicaid Services (CMS)
HDG noted the following:
- Enrollment grew by 50 percent, from 19.6 million enrollees in May 2017 to 29.5 million enrollees in May 2022.
- HMO/HMO-POS remains the largest distribution of plans, but Local PPO had the most significant growth.
- Regional PPO, 1876 Cost, HCPP – 1833 Cost, and PFFS all declined since May 2017.
Special Needs Plans
One of the most significant changes in Medicare managed care is the growth of Special Needs Plans (SNPs). These are Medicare Advantage plans that specialize in sub-populations of Medicare enrollees, including those with certain chronic conditions, dual eligible for Medicare and Medicaid, or Institutional plans. In recent years, this has been a growth area for provider-sponsored plans and value-based arrangements. Table 2 shows the distribution of SNPs and enrollment change from May 2017 to May 2022.
Table 2: Special Needs Plan Types Change, May 2017–May 2022
| SNP Type | Distribution of Enrollment 2017 | Distribution of Enrollment 2022 | Change in Plans 2017–2022 | Change in Enrollment 2017–2022 |
| Chronic or Disabling Condition | 14.2% | 8.4% | 153.8% | 19.4% |
| Dual-Eligible | 83.1% | 89.5% | 96.1% | 116.7% |
| Institutional | 2.7% | 2.1% | 125.0% | 55.3% |
| Totals | 100.0% | 100.0% | 113.0% | 101.3% |
Source: Centers for Medicare & Medicaid Services (CMS)
HDG noted the following:
- Number of plans has increased by over 110 percent, from 615 total plans in May 2017 to 1,310 total plans in May 2022.
- Enrollment has increased by over 100 percent, from 2.4 million in May 2017 to 4.8 million in May 2022.
- Dual-eligible plans account for 58 percent of all plans and 90 percent of enrollment.
Implications for Providers
The growth of Medicare Advantage has several immediate implications for providers. Medicare Advantage plans can be stingy with authorizations and sometimes have lower payment rates than MFFS. The proliferation of plans can mean increased fragmentation for providers, as some plans use unique payment structures and have differing policies. On the plus side, plans can be flexible, covering things like telehealth and providing supplemental benefits.
The first step is to review your contracts carefully and make sure that they are up to date and current with market trends. Often, plans are out of date and have onerous provisions that are no longer justifiable. Second, make sure you are contracting with every viable plan in the market. In these days of declining census, you cannot afford to be turning down viable payors. Third, approach plans with an outcome focus and try to find the win-win by managing the whole episode of care. Another strategy is to pursue a provider-sponsored SNP, possibly in a consortium with other providers. At a minimum, consider value-based arrangements whereby the strengths of your organization can be leveraged to improve quality and lower costs, and you share in the rewards.
For More Information
Health Dimensions Group (HDG) has experts who can help you understand your markets, review your contracts and Medicare operations, and help you form your value-based strategy. If you would like to learn more about how HDG can assist you, please contact us at 763.537.5700 or info@hdgi1.com and visit our website.