
2020 was a difficult year for senior living and services providers. Due to the COVID-19 pandemic, many organizations experienced record lows in census and had increased difficulties in staffing and providing remote services. One exception to the record declines in census was the Program of All-inclusive Care for the Elderly (PACE). In this post, we will explore how PACE continued to grow despite many obstacles, and how PACE will adapt and become even stronger due to the pandemic.
PACE Philosophy and New 2020 Programs
PACE centers on the belief that it is better for the well-being of seniors with chronic care needs, and their families, to be served in the community whenever possible. By providing or coordinating all needed medical and supportive services through an interdisciplinary team (IDT), PACE programs are able to provide the entire continuum of care and services to older adults with chronic care needs, while enabling them to maintain independence in their homes for as long as possible.
The number of new PACE providers grew by six programs in 2020. It typically takes approximately 18–24 months to start a program. Needless to say, no provider that opened in 2020 could have planned to open in the pandemic environment it did when the process to become a provider started so many months earlier.
Figure 1 shows the number of current PACE providers by time frame of opening.
Figure 1: PACE Programs by Time Frame Opened
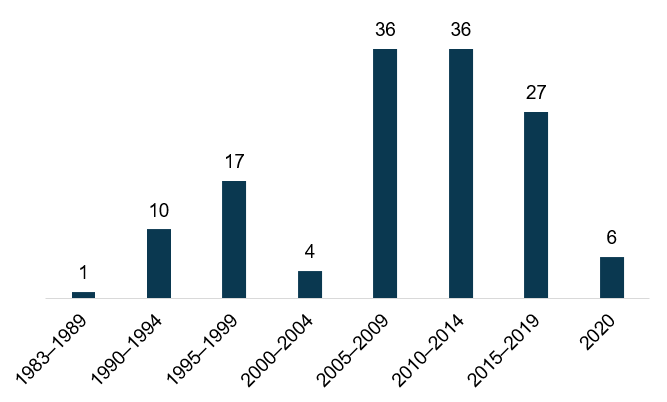 Source: National PACE Association (NPA)
Since 2015, there has been an average of 5.5 new programs that have opened each year. If we go back as far as 2010, there has been an average of 6.3 new programs opened per year, putting 2020 at an average year, despite the expanded difficulties of opening during a pandemic.
Dual-Eligible Enrollment Growth
All senior services providers were impacted by COVID-19 in 2020. Understandably, most providers experienced a decline in census and have struggled to regain pre-COVID-19 levels. One exception to the decline in census is PACE. Even with increased challenges in service delivery, dual-eligible enrollment increased from January 2020 through December 2020. Figure 2 shows the month-to-month dual-eligible enrollment.
Figure 2: Dual-Eligible PACE Enrollment in 2020
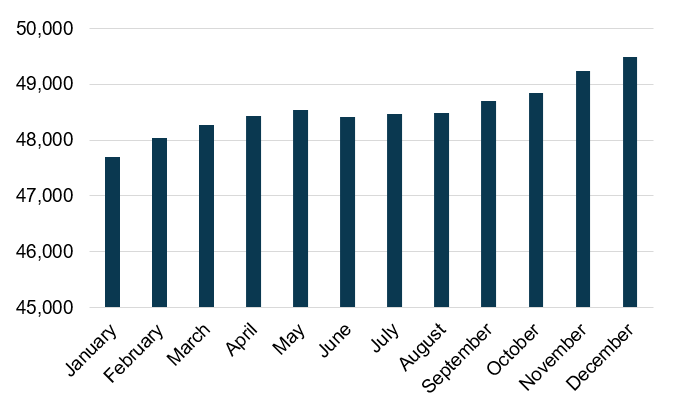 Source: Centers for Medicare & Medicaid Services (CMS)
With the exception of a small May–June dip, every month increased enrollment from the prior month. In fact, dual-eligible enrollment increased by 3.8 percent from January through December.
Some of the PACE dual-eligible enrollment growth is attributed to the addition of six new programs in 2020. However, that only accounts for a small percentage of the overall increase. Figure 3 shows how the 130 programs that operated during all 12 months of 2020 fared between January and December.
Figure 3: 2020 Dual-Eligible Enrollment Change in Programs Open All 12 Months
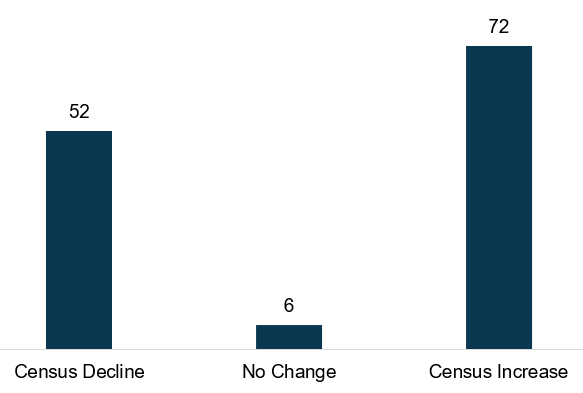 Source: CMS
As shown on Figure 3, for programs that were operating in January, most increased in census throughout the year.
- Of the 52 programs that declined in census, the average decline was 21 enrollees, while the median decline was 13 enrollees.
- Of the 72 programs that increased in census, the average increase was 38 enrollees, while the median increase was 21 enrollees.
- Overall, the 130 programs that were open on January 1, 2020, experienced a cumulative growth of 3.4 percent through December.
Figure 4 shows how programs open for the full 12 months of the prior five years grew compared to 2020.
Figure 4: Annual Growth of Programs Open Full Year 2015–2020
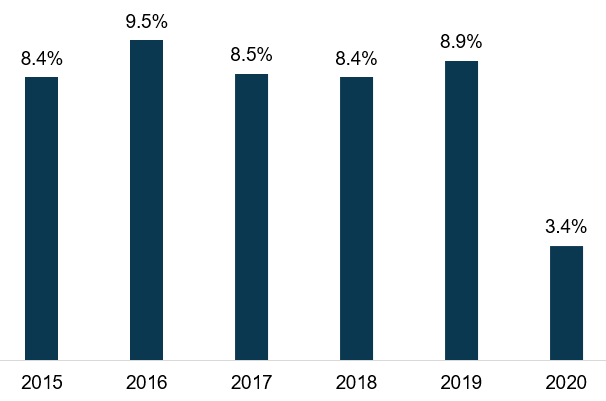 Source: CMS
As shown on Figure 4, if we eliminate any dual-eligible growth resulting from the opening of new programs, PACE programs experienced a cumulative annual growth of between 8.4 percent and 9.5 percent between 2015 and 2019. Although 2020 saw a significant decline in growth from prior years, PACE still experienced overall growth during the pandemic. It is reasonable to assume from Figure 4 that growth will resume to pre-COVID-19 levels once the pandemic ends.
How Has PACE Grown When Other Providers Have Not?
PACE is an at-risk model, which means the program is responsible for directly providing or coordinating and paying for all of its participants’ care needs. Unlike traditional Medicare Fee-for-Service (MFFS), PACE programs have flexibility in how capitation dollars are used to provide the services their participants need. With PACE centers being closed or limited to only necessary clinic visits, programs have had to be creative in developing new ways to care for participants. These creative measures have included redefining staff responsibilities, utilizing telehealth technology, and shifting to delivering care and meals in the home rather than in the PACE center.
If there is a silver lining for PACE programs during this pandemic, it is that the ingenuity displayed by PACE leaders may reveal new approaches to the PACE model of care that will continue to evolve after the COVID-19 pandemic runs its course.
Future Growth of PACE
Starting a PACE program generally takes 18–24 months. Even though COVID-19 has delayed PACE development in some states, six new programs still managed to open in 2020, as previously noted (see Figure 5).
COVID-19 has highlighted the capabilities of the PACE model, and interest from organizations and financial investors in sponsoring PACE has accelerated, which is an indication that significant growth in new PACE plans is coming within the next few years.
Figure 5: PACE States and Provider Locations as of January 1, 2021
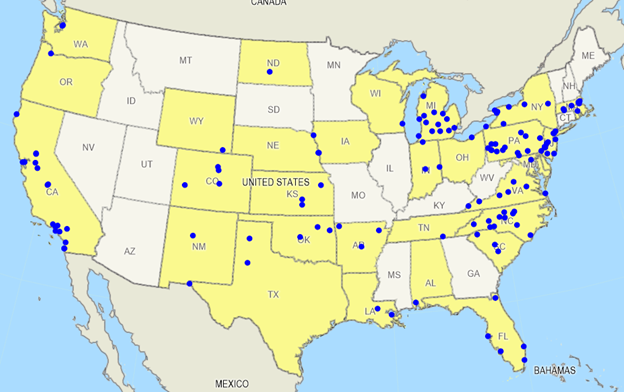
Source: NPA
For More Information
As a National PACE Association Technical Assistance Center, Health Dimensions Group (HDG) has successfully assisted many organizations with PACE market and financial feasibility studies, program development and implementation support, and operational improvement. If you would like to learn more about how HDG can assist you in exploring PACE as a solution in today’s challenging health care environment, please contact us at 763.537.5700 or info@hdgi1.com and visit our website.