
Philosophy
The Program of All-inclusive Care for the Elderly (PACE) operates on the belief that seniors with chronic care needs, and their families, are better served in the community rather than in an institutional setting whenever possible. By providing or coordinating all needed medical and supportive services through a comprehensive team of professionals called an interdisciplinary team, PACE programs allow older adults with chronic care needs to maintain independence in their homes, avoiding or delaying permanent placement in long-term care settings.
Target Population
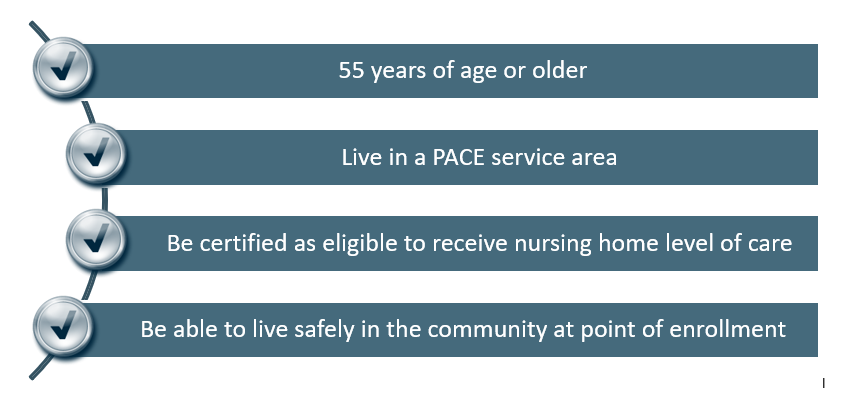
PACE programs care for a frail, elderly population that meets their state’s definition of nursing home level of care.
Figure 1: Eligibility Requirements for Enrollment into PACE
Total Population
The population within the 134 PACE service areas varies tremendously, with a range of 64,000 to over 12,000,000, indicating both large and small markets can support a program. The median population size is 629,000.
Senior Population (Age 55+)
Seniors are typically defined as age 65 and older, but the age requirement to enroll into PACE is 55 years. In 2020, the mean senior population of PACE service areas is 192,000, but there is a wide range, from 25,000 to nearly 3,500,000.
Service Area Geography
PACE programs have a service area rather than a market area. A market area is where a majority of the clientele will originate, but individuals from outside the market area can also use services. PACE programs are assigned a service area, which is a geographic area that is mutually agreed upon between the PACE program, the State Administering Agency, and the Centers for Medicare & Medicaid Services (CMS). In order to enroll into a program, an individual must live within the designated service area. Service areas are defined by counties and/or ZIP codes.
In 2020, the total service area for the 134 active PACE programs covers more than 218,000 square miles, averaging 1,750 square miles per program. More densely populated markets tend to have smaller service areas since they can achieve needed census levels in less geography. Six programs have less than 100 square miles, with the smallest covering only 35 square miles!
Many service areas require a larger footprint to achieve their census targets. In fact, 82 programs have service areas covering more than 1,000 square miles, with the largest program covering a staggering 8,100 square miles!
Payor Mix
Although not a requirement, more than 99 percent of individuals enrolled into PACE are eligible for Medicaid.
Figure 2: PACE Enrollee Payor Distribution
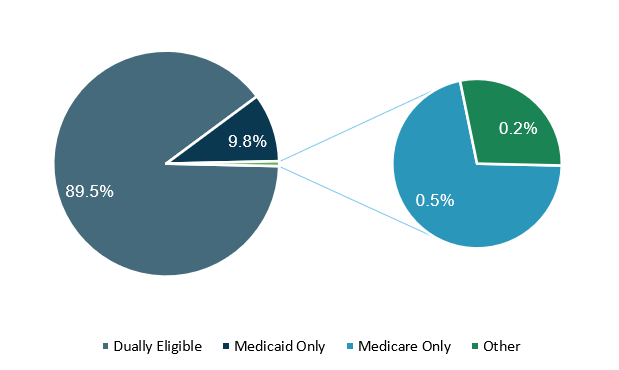 Source: National PACE Association
Since most PACE enrollees are eligible for Medicaid, PACE programs tend to be located in markets with large populations that are dually eligible for both Medicare and Medicaid. In 2018, 19.8 percent of all Medicare beneficiaries nationwide were dually eligible. In counties that have at least a portion of their geography served by a PACE program, an average of 22.4 percent of Medicare beneficiaries are dually eligible, indicating higher than average Medicaid eligibility.
In October 2018, the national Medicare Advantage (MA) penetration of Medicare beneficiaries hit an all-time high at 40.2 percent. PACE counties have an even higher MA penetration at 44.5 percent, indicating higher participation.
Utilization of Services
Medicare Fee-for-Service (MFFS) beneficiaries living in PACE markets do not utilize services significantly more than the national average, but do tend to use costly, preventable services more often, such as inpatient hospitalization and skilled nursing facilities. They are also more likely to be readmitted to the hospital and use ambulance services.
Figure 3: 2018 Utilization of Services by MFFS Beneficiaries
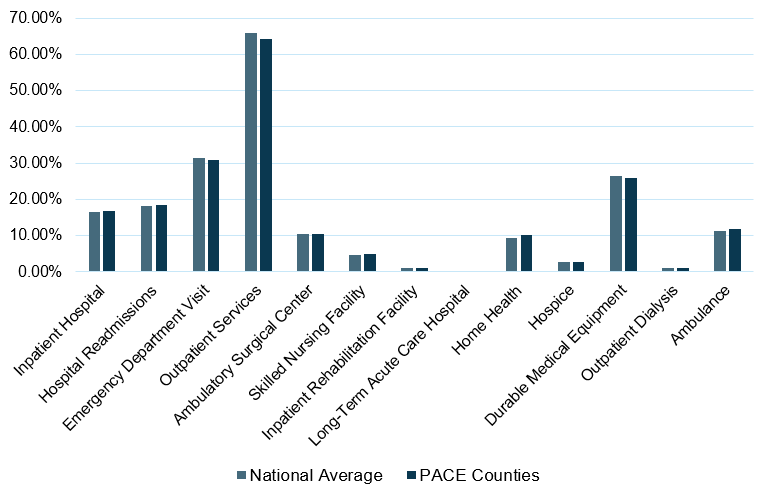 Sources: CMS and HDG analysis
PACE programs utilize their interdisciplinary teams to create care plans, in partnership with program participants and family members, that provide and coordinate care and services in order to avoid costly preventable services such as emergency room visits, inpatient hospitalizations, and long-term institutional admissions.
Chronic Conditions
PACE counties tend to have an MFFS population with a higher prevalence of chronic conditions compared to the national average.
Figure 4: 2017 Chronic Conditions by MFFS Beneficiaries
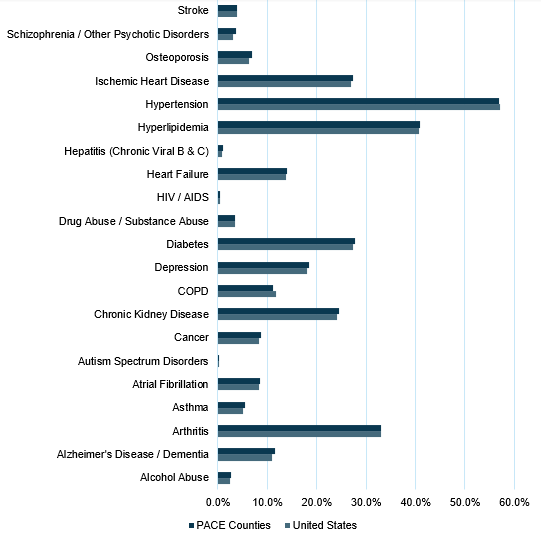 Sources: CMS and HDG analysis
The PACE model is designed to specialize in caring for the most frail populations that have medical needs qualifying them for nursing home level of care. PACE programs have continually been successful in keeping a majority of members living in the community by managing care needs that would otherwise put them at risk of institutional placement.
PACE Program Enrollment
Enrollment growth and market penetration are critical to the financial success of PACE. There are currently 134 PACE programs nationwide, with a total enrollment of more than 54,000. Program enrollment ranges from 0 for newly opened programs to 3,300 in the largest program. The average program enrollment is 405, but the median is much lower at 247. The average PACE program market penetration rate is 10 percent of the PACE eligible population in a service area.
Because of the fixed costs necessary to start a program, break-even cash flow usually takes 18 to 30 months to achieve. This break-even point typically occurs with enrollment of 100 to 150. Positive margins and return on investment typically begin to accumulate rapidly as enrollment grows beyond the break-even census. There are several other factors that influence how quickly break-even cash flow can be achieved, but enrollment is the most critical.
For programs that have started operations over the last five years, enrollment growth has averaged five per month in Year 1, four per month in Year 2, and three per month in Years 3 and 4. Rapid enrollment growth and a high market penetration rate have, more often than not, resulted in positive financial performance.
It is very important for PACE organizations and organizations exploring PACE development to understand their market demand and to develop a well-coordinated marketing and intake effort to be able to maximize market penetration and enrollment growth in order to limit operating losses, reduce the working capital need, and achieve a financially self-sustaining program.
Is Your Organization a Good Fit for PACE?
Does your organization serve a high number of dually eligible frail seniors who are high utilizers of costly services? If so, PACE might be your solution to better manage their care while also maintaining their independence in the community.
For More Information
As a National PACE Association Technical Assistance Center, Health Dimensions Group (HDG) has successfully assisted many organizations with PACE market and financial feasibility studies, program development and implementation support, and operational improvement. If you would like to learn more about how HDG can assist you in exploring PACE as a solution in today’s challenging health care environment, please call or email us at 763.537.5700 or info@hdgi1.com and visit our website.