
There are many key factors to the success of a Program of All-inclusive Care for the Elderly (PACE) program. One key factor is census. Programs are paid on a per member per month (PMPM) basis. PACE program financial performance is largely driven by census. This post will explain how to use data to help increase your PACE census by identifying where potential participants live.
PACE Philosophy and Eligibility for Enrollment
PACE centers on the belief that it is better for the well-being of seniors with chronic care needs, and their families, to be served in the community whenever possible. By providing or coordinating all needed medical and supportive services through an interdisciplinary team (IDT), PACE programs are able to provide the entire continuum of care and services to older adults with chronic care needs, while enabling them to maintain independence in their homes for as long as possible.
Candidates for enrollment into PACE must meet the following criteria:
- Be 55 years of age or older.
- Be determined by the State Administering Agency (SAA) to require a level of care defined under the state Medicaid plan for coverage of long-term care services (i.e., clinically eligible for PACE).
- Reside in a specified PACE service area.
- Be able to live in a community setting at the time of enrollment without jeopardizing his/her health or safety based on criteria set forth in the PACE program’s three-party program agreement.
Assessing Demographics
In order to achieve your enrollment targets, you first need to know the number of potential enrollees. Creating a target with no knowledge of the actual number of candidates or using older and out-of-date information will greatly increase the likelihood of falling short of your projections. Additionally, it is important to use the appropriate income and disability criteria that most closely aligns with your state. If you overestimate income and/or disability methodologies, then you will overestimate the number of candidates in your market.
Continually Monitor Current and Projected Demographics
It is important to know how many candidates currently live within your service area, and more importantly, how many will live there in the future. Current year estimates and future projections are more accurate the more granular the methodologies. For example, calculate the number of candidates by age cohort, as opposed to a broad calculation for all ages. Disability and income vary by age cohort, and applying broad assumptions will either overestimate or underestimate the actual target populations.
It is also important to calculate data at the ZIP code level. Most PACE service areas include either ZIP code and/or county designations. A granular review at the ZIP code level will help determine where the candidates live, as opposed to simply looking at how many overall candidates there are.
Five-year projections will also help determine growth in the service area, and identify any changes in where the senior population will live in the future that may be different than now.
Figure 1: Growth of PACE Eligibles in PACE Service Areas:
2020–2025 PACE Programs
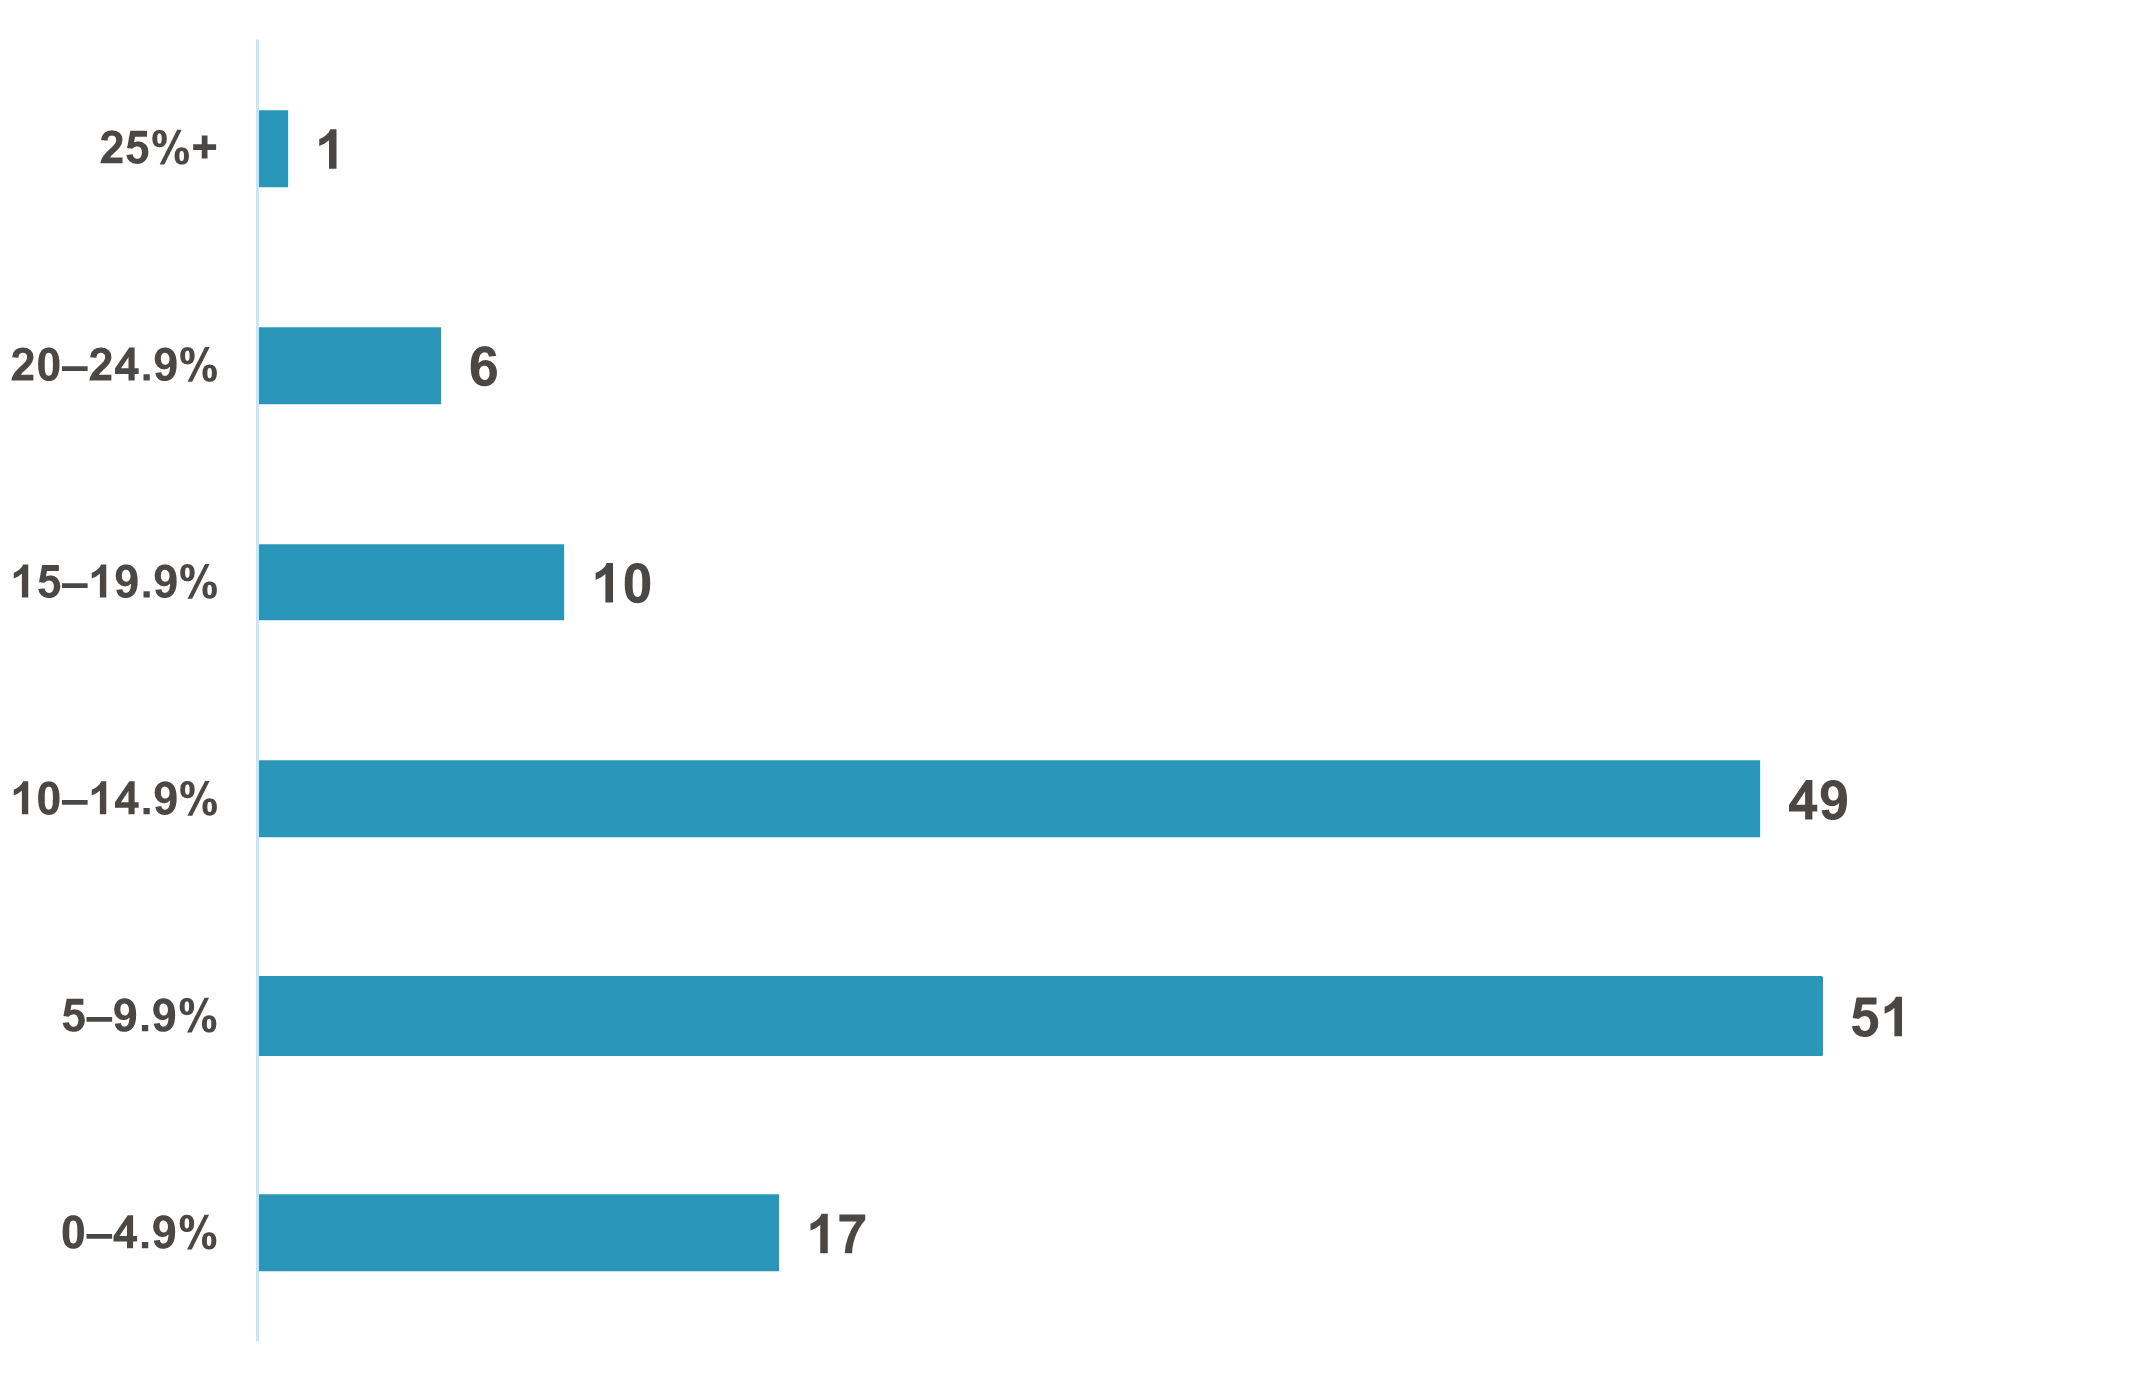 Most programs are projected to have an increase of between 5 and 15 percent in the number of candidates for enrollment into PACE from 2020 to 2025. However, 17 programs will see growth of less than 5 percent. In order for these programs to achieve future enrollment targets, they will need to increase market share, as growth of the senior population alone will not be enough.
Review Race/Ethnicity and Sex in Your Service Area
A review of the race and ethnicity and sex of your service area is important in assuring you are marketing to specific populations, based on language and/or cultural needs. A singular marketing plan of one-size-fits-all will not be appealing to everyone. Knowing the diversity of the target population and how this will change over time will help better prepare your marketing plan.
Figure 2: Growth of PACE Eligibles in PACE Service Areas:
2020–2025 Race/Ethnicity
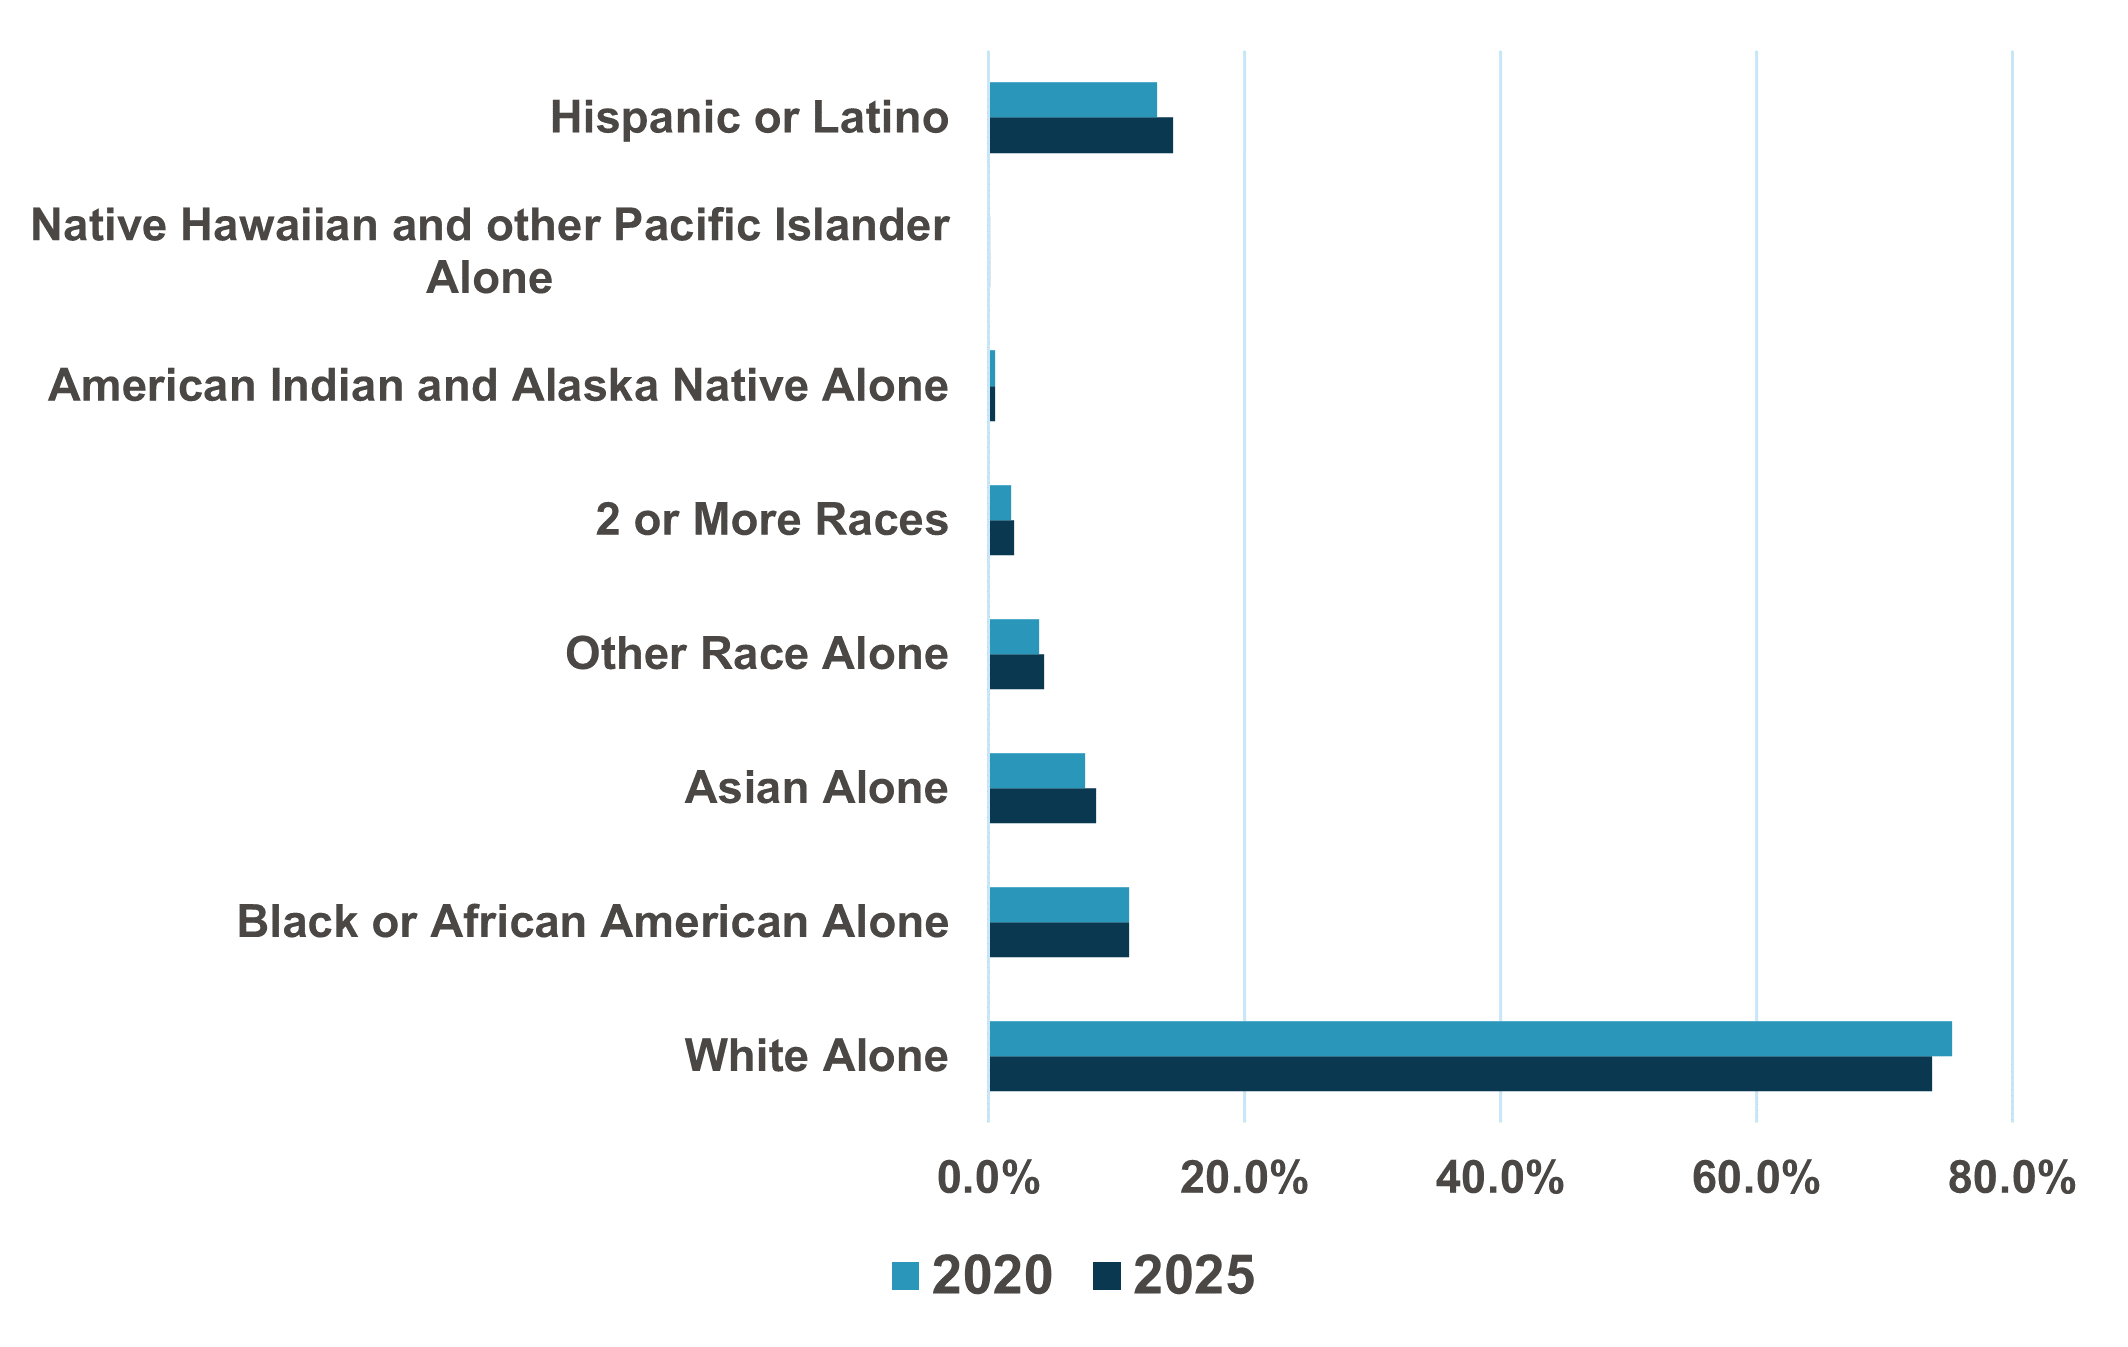 As seen above, although “white alone” remains the largest racial category, the senior population is becoming more diverse.
Figure 3: Growth of PACE Eligibles in PACE Service Areas:
2020–2025 Age Cohort and Sex
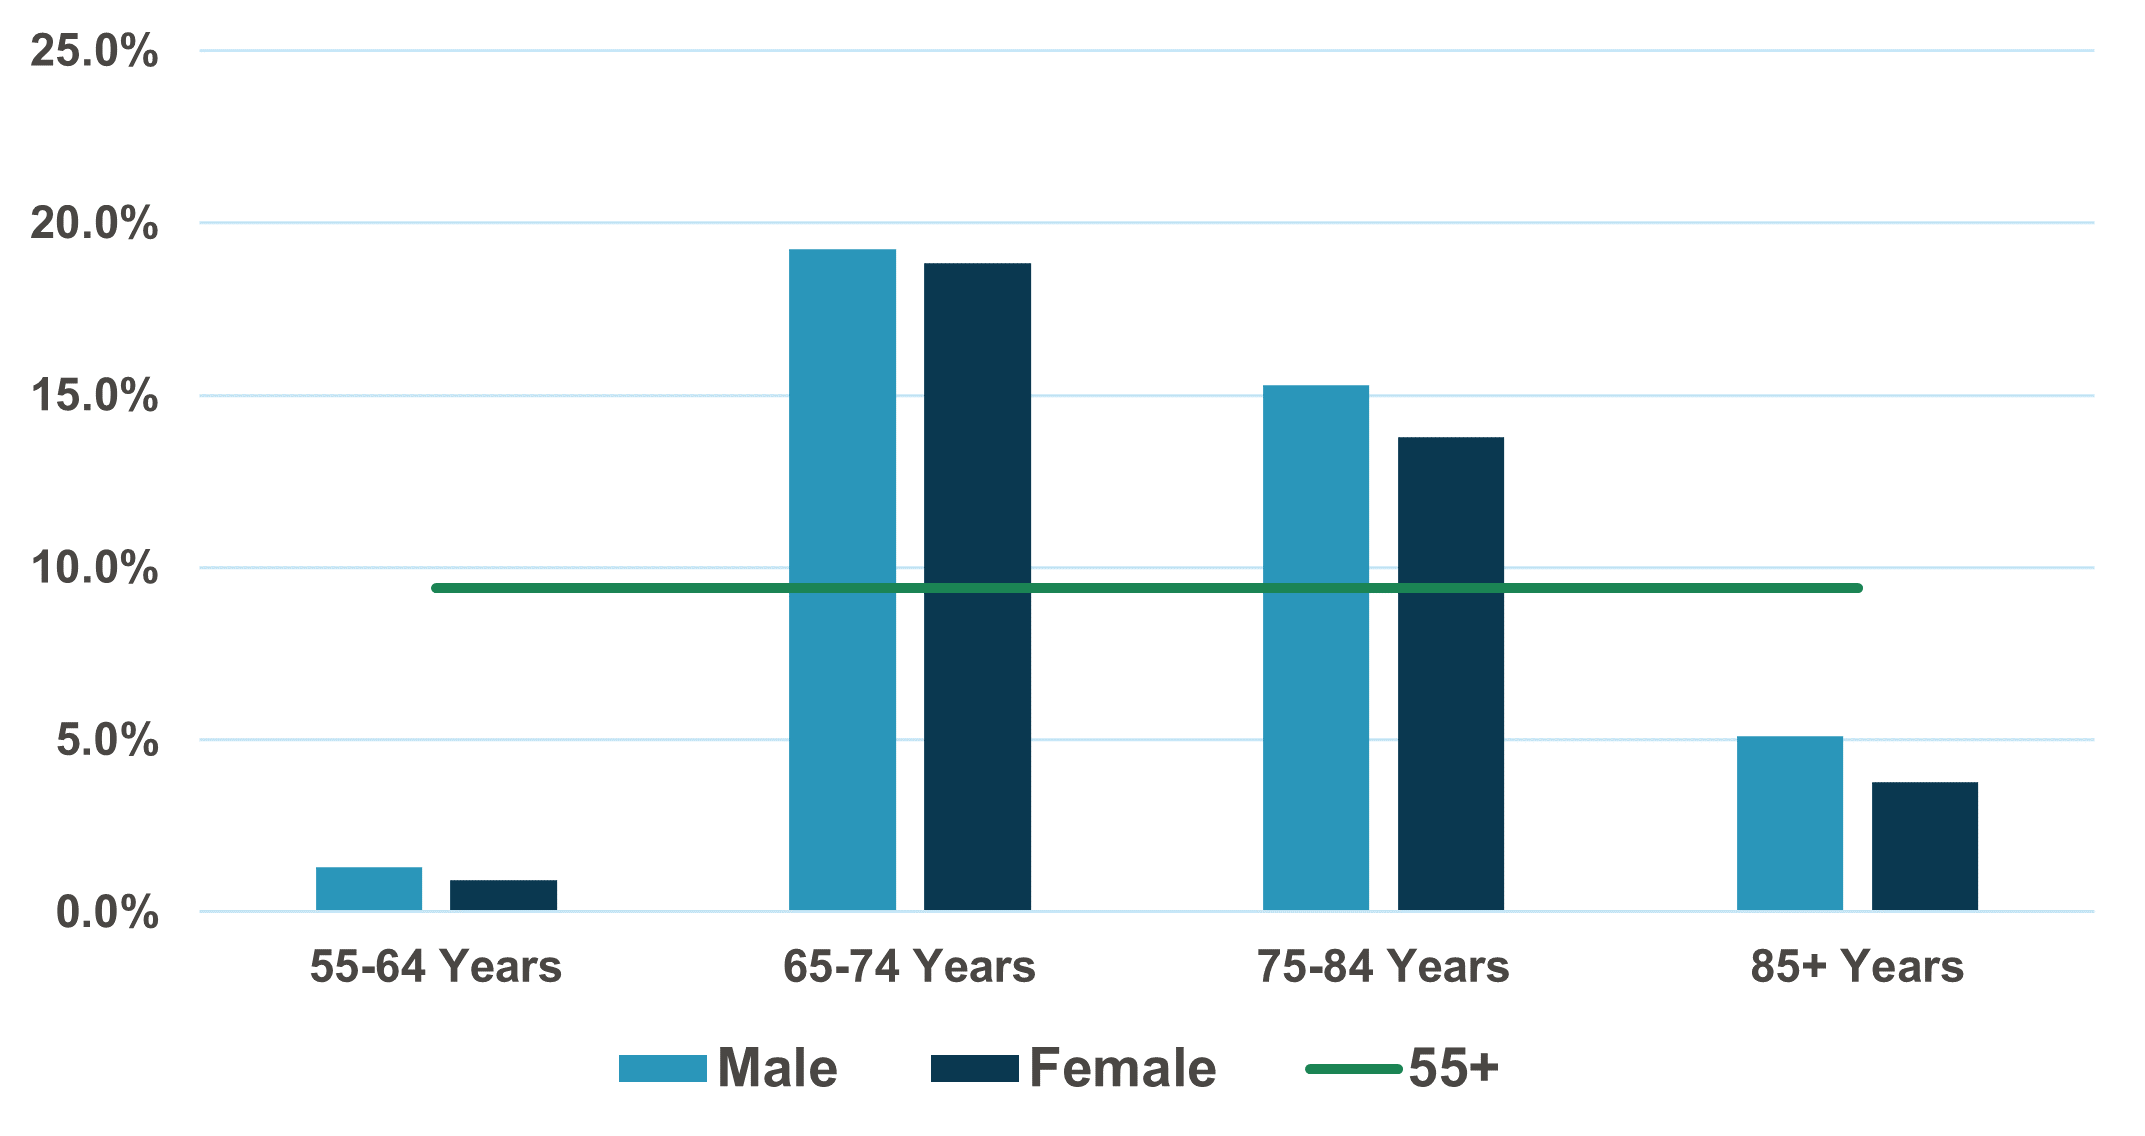 Female population is 19 percent larger than the male population, but male population is increasing faster over the next five years.
Assessing the Workforce Population
Once the number of candidates for enrollment into PACE is determined, we need to then determine how to serve the population. A review of the demographics for the workforce population is becoming increasingly important. Health Dimensions Group (HDG) recently analyzed an existing PACE program’s service area and determined that although the number of potential enrollees was increasing, the workforce population was decreasing in every ZIP code within the service area. A strong plan to attract and retain staff will be crucial in assuring this program will have the staff available to achieve their census targets.
Determine Your Penetration Rate
Calculating your penetration rate, by age cohort and ZIP code, will help set your current reality so you can create goals for future growth. The penetration tables will identify areas where there is additional opportunity to grow and may refocus where your marketing dollars are being spent.
Figure 4: Historical PACE Penetration Rate
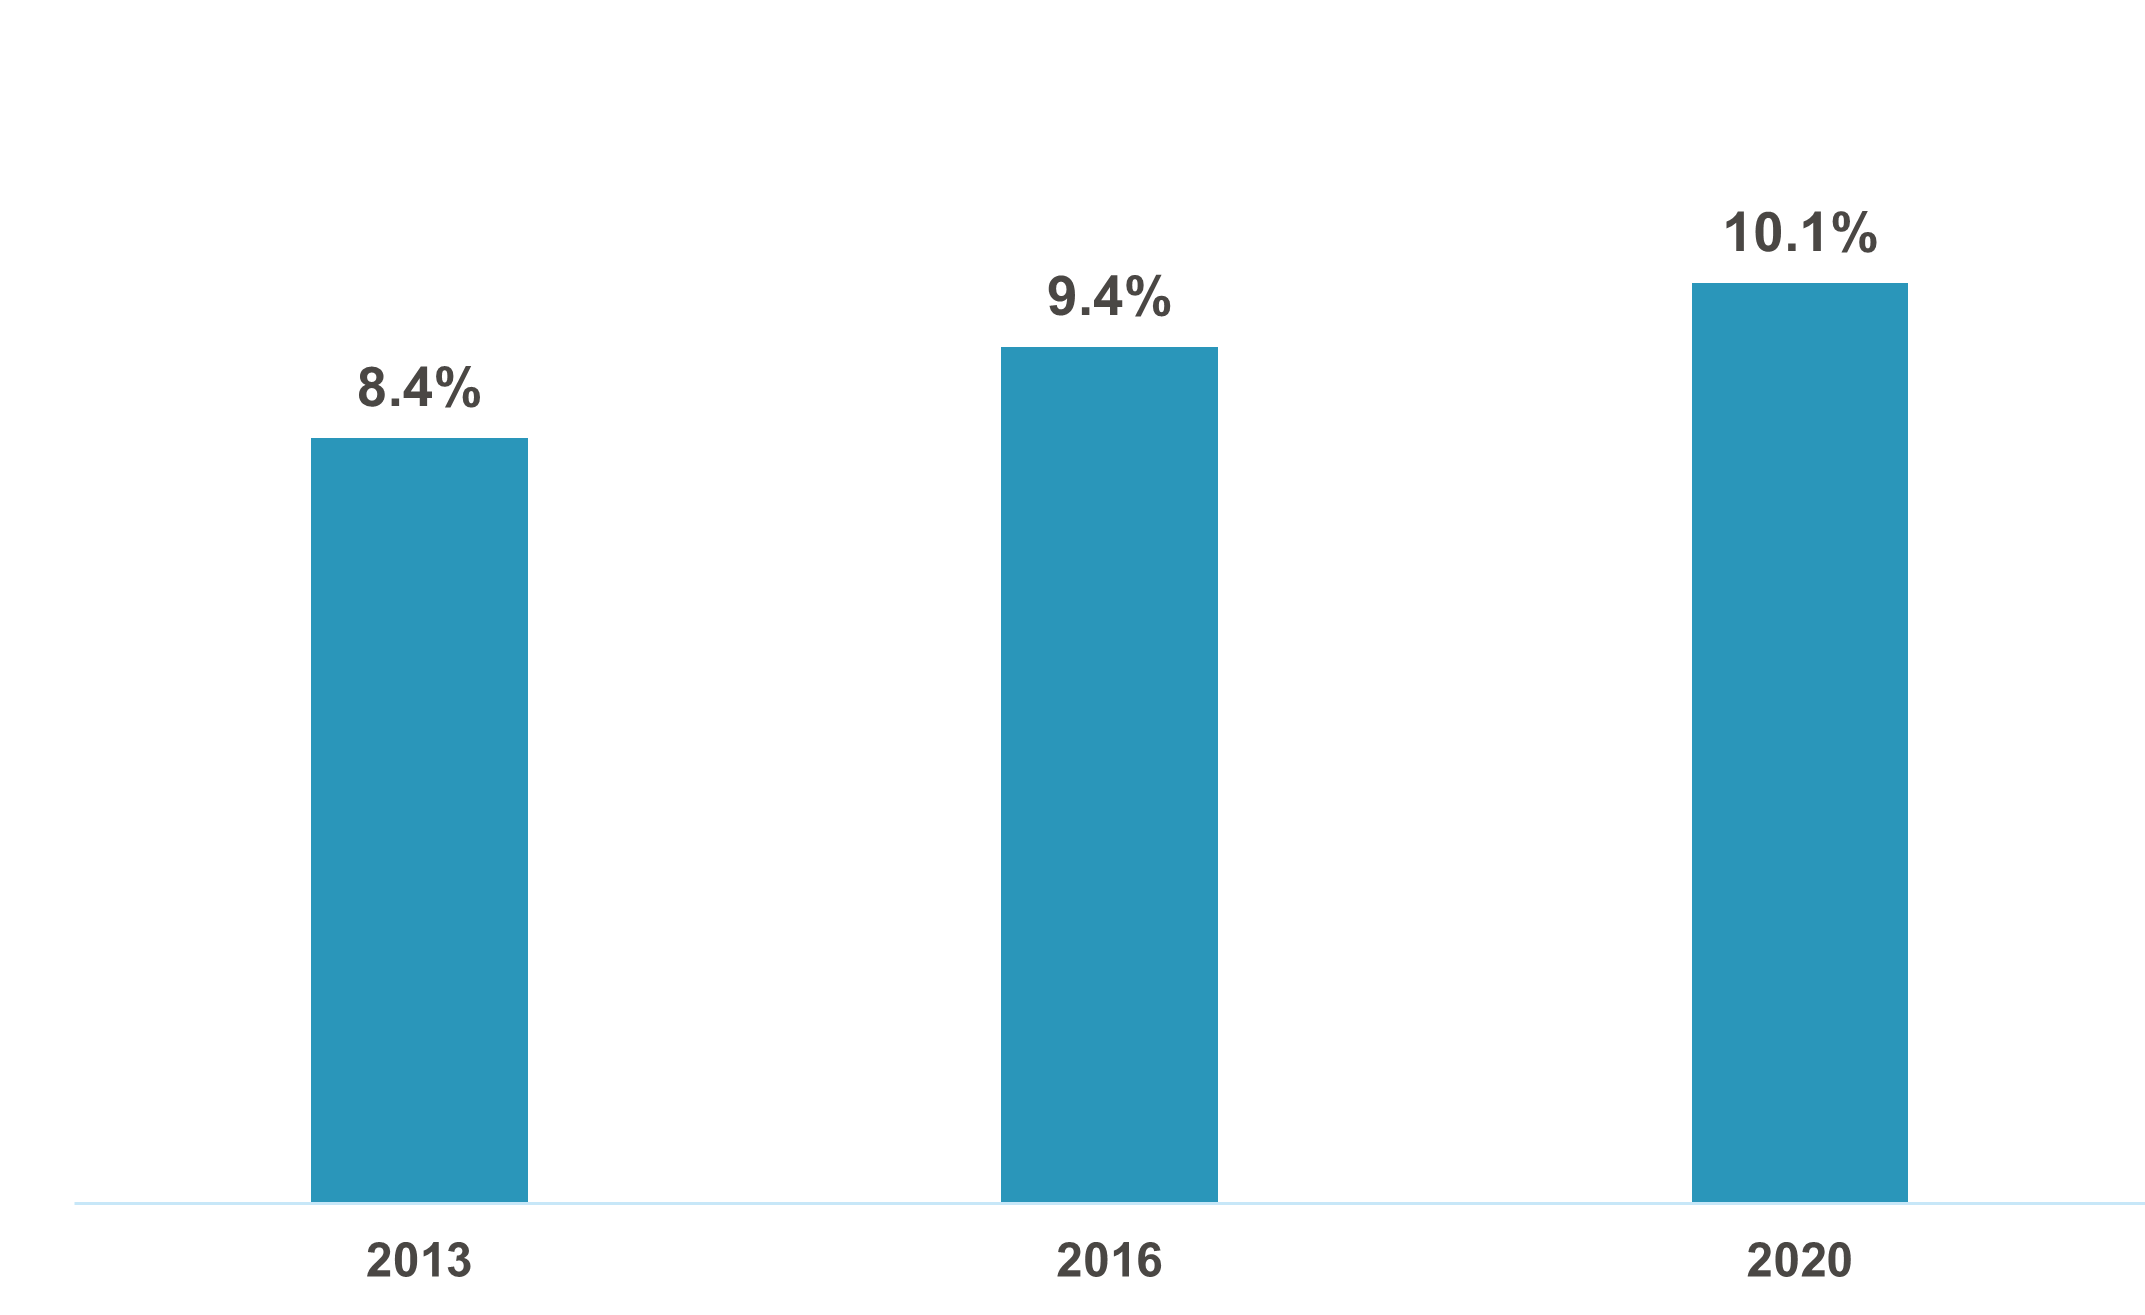
HDG has completed national analyses three different times and has documented an increase in overall penetration rate. It is important to note penetration rate varies by program and state. Creating reasonable benchmarks comparing your program will be an important step in creating reasonable future target goals.
Map It
Heat maps for both current year and future years will help visualize where candidates live. Having completed dozens of analyses, with no exceptions, the closer participants live to the PACE center, the higher the penetration rate. A review of heat maps will help identify future expansion opportunities for new PACE centers and/or Alternative Care Settings. It will also identify pockets of potential where increasing your marketing efforts will have the biggest impact.
Mapping will also indicate growth opportunities for expanding your service area definition. Will the program be able to support additional ZIP codes and/or counties with the current PACE center, or will another location need to be added? Is there sufficient demand in these ZIP codes to add them to our service area definition? Growth opportunities can be a combination of increased market share and an expansion of the current market.
For More Information
As a National PACE Association Technical Assistance Center, Health Dimensions Group (HDG) has successfully assisted many organizations with PACE market and financial feasibility studies, program development and implementation support, census growth, and operational improvement. If you would like to learn more about how HDG can assist you in exploring PACE as a solution in today’s challenging health care environment, please contact us at 763.537.5700 or info@hdgi1.com and visit our website.